Statistical process control after W. Edwards Deming
Introduction
Sometimes called “The Father of Quality Management”, William Edwards Deming shaped the field during the twentieth century.
His work is strongly focussed on production processes, shop floors in automobile or other traditional industries, but I believe that a lot of it carries over to other fields, even software development. Fields like medicine have taken notice of Deming's work, after all.
But even if you do not see an immediate application to your daily work, I think that knowing a little bit about Deming and his work contributes to your cultural enrichment. Deming had large influence on the world's economy, albeit indirect in some instances.
A statistics professor at business school and a freelancing consultant, he advocated for statistical quality management in the industry, and in educating the managerial class in those statistical methods, as opposed to ad-hoc ones.
Deming wrote several books, the best known ones may be “The New Economics of Industry, Government, and Education” and “Out of the Crisis”. You can see from the titles that they are wide-ranged in topic, not textbooks on statistical methods.
A lot in the books is political. He writes about America in the world. Topics are all sorts of things: Ethics of managers, the postal service, many other things. Some of it hasn't aged well, like his incredulity why the Government broke up a beautiful monopoly like Bell Telephone. Other things seem random, like his discussion of the phenomenon of hitting your children when they bring home bad grades. The first chapters in “New Economics”, at least, read like “Old Man Yells at Cloud”. Fortunately, after you slog through that all, you get to the real meat of the book.
Deming and Systems
A central pillar of his managerial philosophy is that the problem is not the people themselves.
Quote
Ranking is a farce. Apparent performance is actually attributable mostly to the system that the individual works in, not to the individual himself.
Quote
Abolish ranking […] Manage the whole company as a system.
Doesn't the last quotation ring a bell? Jack Welsh at GE? Microsoft until fairly recently? Those companies (and their managers) believed that workers were their antagonists. Any substandard performance must be because the workers are incompetent or lazy, so you should replace them with “rock stars”.
Deming was always thinking in systems, not individuals. He has often performed two experiments in his workshops for managers: the red beads experiment and the funnel experiment. We'll come to the latter a few chapters down, but the red beads experiment is pertinent here. Unfortunately it is rather unspectacular, even mundane.
I'll spare you a move-by-move re-enactment and just summarize it. If you're interested in more details, there are several videos on YouTube showing Deming himself performing this experiment with participants from an audience.
The red bead experiment has several people (“workers”) shovel beads from a box. There are red beads and white beads, and their shovels are paddles with little depressions, so the beads can settle in them and you can fish them out of the box. The workers are directed to get as many white beads (and as little red beads which signify defects) as possible. The experiment goes over several rounds, with lots of procedure (“you must hold the paddle like this”) and the workers' performance is tallied and tabulated.
The experiment is set up so that an individual worker's performance is largely random. You cannot use skill to reliably fish out one sort of beads. And that's the whole point. The system makes the outcome random, the individual is helpless. So it doesn't make a whole lot of sense to reward a good performance or punish a bad performance. Boring, I know. Try watching the experiment for 15 minutes.
That does not mean that people are not important, in fact Deming believes exactly the opposite:
Quote
The most important application of the principles of statistical control of quality […] is in the management of people.
But the most important thing to take away from this part is: Systems are important.
Deming's significance
Deming tried to get his ideas adopted in America, but he fell largely on deaf ears with American industrialists. That isn't terribly surprising, you need to understand the times, especially shortly after World War II: Americans were the rulers of the world. Europe was in ruins, sometimes even still smoking. China wasn't the high-tech supplier it is today, but a poor agrarian country. BRIC wasn't even invented as an acronym, and nobody talked about the “tiger states”.
Why indeed should America change its ways? The future looked bright.
Not only lay Europe in ruins, Japan did, too, maybe even more so. America was occupying Japan, and the story goes that General MacArthur exploded with frustration when his phone call to another island of Japan repeatedly broke off. So he wanted to re-build Japan, at least some infrastructure.
Well, that's probably not exactly what happened, the story is apocryphal after all, and many other people were in favor of helping rebuild Japan. But the important thing is: America decided to help rebuild Japan. And so many experts from all kinds of fields embarked and came to Japan.
Deming was one of them. And suddenly he was respected, nay, even sought after.
The Japanese were naturally even more interested in rebuilding Japan than the Americans were. They worked hard on their economic miracle. And we know how that went.
There are fascinating video clips on YouTube showing Americans demolishing Japanese cars. With baseball bats. Even politicians in their campaign videos doing violence to Japanese products.
I can only assume that the Japanese weren't terribly impressed with Americans destroying their own property, that they had already paid for.
Okay, but back when Deming went to Japan, they didn't know yet how Japan would rise from the ashes. MacArthur certainly did not have the intention to have Detroit become a wasteland of once-mighty factories, but well, the man wanted to make a phone call.
As I said, the Japanese were very interested in what Deming had to teach them. He was known in quality management circles, after all, it was only the big practical implementation that he wasn't able to do in America. It started with the engineers' association, he got contacts to middle management, later to top management, and he taught them what he believed in. The top brass (think CEOs) of big Japanese companies attended his seminars. He was a star, and he got numerous awards and honors in Japan.
Deming did not invent the newfangled things that the Japanese used to effect their economic miracle. He did not invent the Toyota Production System, he did not invent Kanban, or Total Quality Management.
But his disciples did.
All of that was mostly taking place from the fifties to the eighties. For broad recognition in America, Deming had to wait until much later.
The Deming cycle
Those Japanese came after him, but whose shoulders was Deming standing on?
Walter Shewhart.
Much of what Deming is known for already existed in some form or another with Shewhart. Which is no accident, Deming studied under Shewhart, and later worked with him. And the best-known thing from Shewhart is the Shewhart cycle:
Plan – Do – Check – Act. A staple of project management. Also called the PDCA cycle, the Scrum sprint or – wait for it – the Deming cycle.
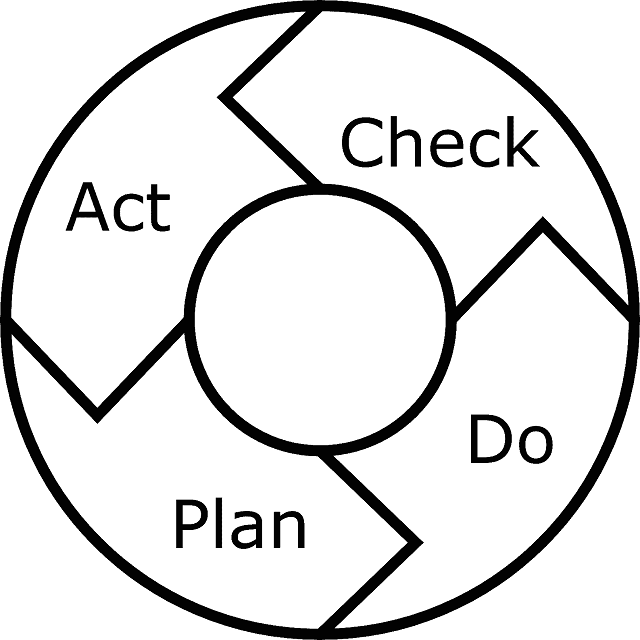
Deming himself always called that concept the Shewhart cycle.
But Deming also changed the Shewhart cycle in one small respect. He struck out “Check” and wrote “Study”. It seems inconsequential, but Deming insisted on that. To him, “check” sounded like “inspect”.
Deming hates inspection. With a passion. Read his books, he goes on and on about the evils of inspection.
Quote
You can not inspect quality into a product.
But what is inspection? Inspection is when you take a produced widget (or printed circuit board, or car), measure its properties, and compare to some specification. On the basis of that check you decide whether to ship the product, or throw it away (or re-melt it), or fix it.
The idea is to throw away what's outside the specification. You start with the specification and produce “to spec”.
Quote
Eliminate the need for inspection on a mass basis by building quality into the product in the first place.
This last quotation is easy to misunderstand. Deming did not say “just produce widgets and never look at them, then wait for customer complaints”. When setting up your production, you will need many trials and you will want to check every time how it went. When you have a running production you still want to sample your output and see whether it's good. But you shouldn't measure every one the widgets you produce and decide for each one whether to sell it or to dump it.
But what else are you supposed to do?
Statistical process control
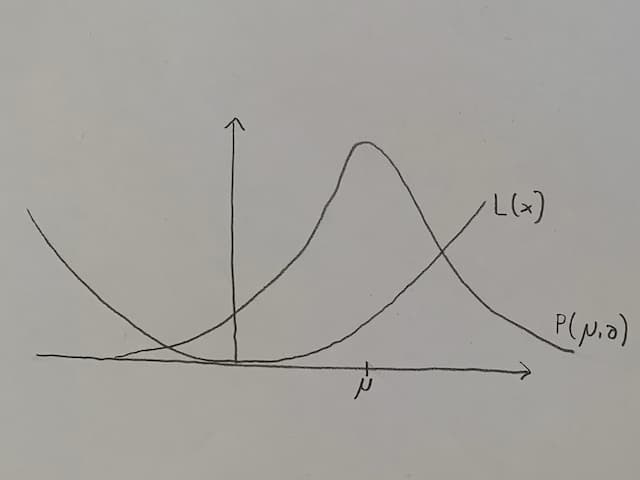
The production process can be modelled using a production function P(μ,σ), which is distributed approximately normally, with μ as the mean and σ as the standard deviation of the distribution.
Why a normal distribution? Because in practice it seems to work well (the Central Limit Theorem tells us that under rather lax conditions, you see approximately a normal distribution). And because there are “nice” theorems about it, so you can calculate practical things with it.
The x axis shows a (continuous) measurement, maybe the widget's length or its weight. At x equals zero is what the production process “is supposed to do”, with deviations being random errors.
The y axis gives us the amount of widgets made for any measurement on the x axis.
This is a simplification, of course. Your production process may not be normally distributed, its graph may be asymmetric, askew, with steps in it, and so on. It doesn't matter for the explanation of the general method.
In addition to the production function, there is a loss function L(x). It matters how long or heavy the widget is. If it's close to what you want it to be, but not quite, that's probably still okay. If it's far away, that's bad. So the loss function may look like a parabola.
Again, it doesn't have to. If you think about catching a bus, and you're half an hour early, that's bad. If you're five minutes early, that's good. If you're one minute early, that's better, but not much better. Waiting five minutes isn't so bad. But if you're one minute late, you've missed the bus and you'll wait another hour. In this example your loss function would be something like a parabola left of μ, but a step towards its maximum at μ.
In general, the loss function's parabola may not be centered at the production function's μ.
A new function f(μ,σ) now combines the production and loss function, by multiplying both and integrating over the whole domain. It weighs the number of widgets produced at a certain x one the one hand, and the loss incurred at that x on the other hand, to give a total loss. And now there is an optimization problem: when does f take on its minimum?
By the way
I would think you need a bit more machinery, like a real convolution, wouldn't you? But Deming shows a multiplication, unless I have misunderstood the notation.
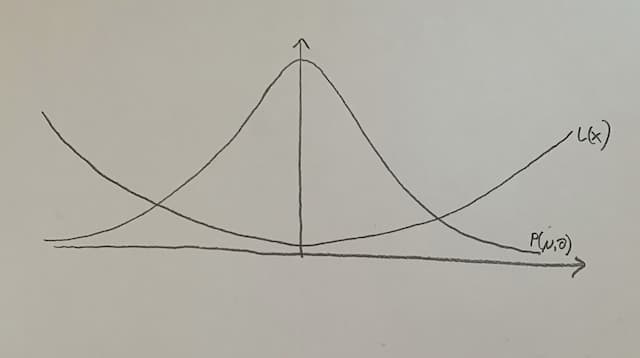
For usual functions P and L (and especially in this example) it's obvious: μ should be where the loss function has its minimum. If that is the case, most of the widgets will not incur much loss, and those widgets that incur loss are few.
Another possibility is to improve the production process, so that the production function's graph is narrower, or in other words, the standard deviation (and therefore the variance) gets smaller. Widgets far outside μ are still costly, but there are even fewer than before.
It helps, but centering the process on where the widget's length, height, etc. is supposed to be usually gets better results than narrowing the process around the wrong μ. So Deming tells us to center our process, putting our expected value μ where we want it to be, and only then work on reducing the variance.
What does centering the process mean? First of all it means to set up your production correctly. When your machine is set up to produce widgets that are 5 centimeters long, you may still get a few that are 4 centimeters long. But if that is what you really need, don't rely on variance, but make sure the machine is set up for 4 centimeters. Also the general handling of the machine is in this category. When the operator has not understood how to operate the machine correctly, the result may be systematically off.
Reducing the variance is more concerned with maintenance. Does the machine need to be oiled? Are parts defective that need to be replaced? But handling still plays a role. One operator may do it differently than the other. Having a single way to do things in place, and training people properly are a part of reducing the variance.
Types of errors
Let's talk about errors. There are two fundamentally different categories of errors, and Deming is adamant about investigating what category an observed error belongs to: there are special causes of variation and common causes of variation.
By the way
If you're working with safety-related systems this nomenclature may throw you off for a moment. “Common causes” in this sense are not about errors with a common cause, like a single electromagnetic pulse coupling into two different wires. Here, “common” simply means “regular” or “not special”.
Why is it important what category an error belongs to? Because they must be treated differently!
Common causes, which Shewhart called “chance causes”, happen randomly. They are the normal process variance. They happen all the time, and there isn't a single specific action to eliminate them.
Special causes or, as Shewhart called them, assignable causes are often caused by a low-level worker. The term “assignable cause” is quite good, because the intuition is “there is something or someone we can point the finger at”.
For example, a backhoe dug at the wrong place and now your factory has no electricity anymore. That would be a classic special cause. You can identify what was responsible: “the backhoe”, “the driver”, “the planner” or maybe “the one who didn't think of redundant and fail-safe power supply”. It doesn't happen regularly, and you certainly wouldn't call it a normal part of your production process.
But if you're a big, nationwide telecommunications company, some backhoe cutting one of your cables is probably not a special cause, but more like “Tuesday”. It happens often enough that you shouldn't see it as a singular act of god, but something that can be statistically modelled, and where the avoidance of that source of error should be part of your normal business and its processes and procedures.
These special causes can be viewed as a non-predictable and statistically unmanageable source of errors, that overlays your common cause errors, making the common cause errors harder to model and treat.
How do you treat and remedy all those errors then?
For special causes that's easy: you eliminate them one by one, because otherwise your process is unpredictable and therefore not in control. They cannot be remedied by decree from above, they need to be remedied on the low level, where they usually pop up. Since they are random singular events you cannot eliminate them all for good, but you must try.
Common causes are treated entirely differently: you control them by getting your process under control. That means centering your process and narrowing the variance. And then comes the most important part of all.
Keep your hands off!
Really. You treat them all at once, by getting the process under control. You never try to treat one of those individually.
But what happens if you treat a common cause error by itself? Glad you asked, because now I can tell you about Deming's second famous experiment, the funnel experiment.
The funnel experiment
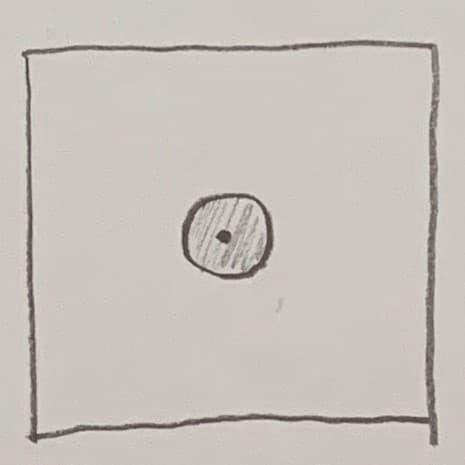
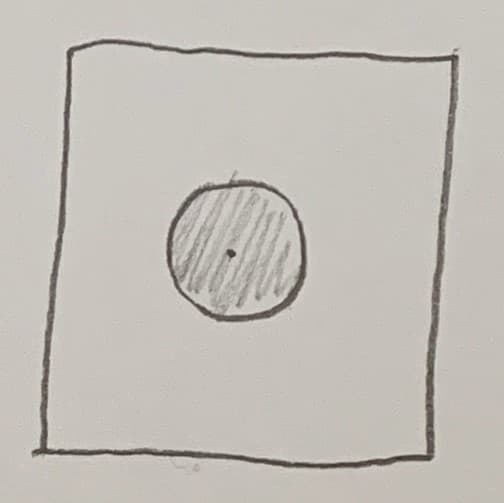
In the funnel experiment Deming put a sheet of paper on a table, marked a point in the middle as the target point (let's call it T) and held a funnel with some distance right over the target point. He then put a ball down the funnel and marked where that ball hit the paper. Usually it hit a bit besides the target point T, let's call the point H.
And now there are four different strategies how to proceed. Each of those strategies tells you how to move the funnel (and thus define a new target point T') after each ball. He repeatedly threw balls down the funnel, which was placed according to the strategy chosen, marked the new hit points H', H'' and so on, and after a few dozen balls or so you see a distribution pattern.
The first strategy was precisely what he recommends for common cause errors: “Hands off!”. The funnel stays where it is, so T'' = T' = T.
The resulting pattern looks circular, and fairly small:
The second strategy was what many people do: correct the funnel for a perceived bias. If a ball hit at point H, and that point H was three millimeters left of the target point T, move the funnel three millimeters to the right. The new target point T' is therefore three millimeters to the right of the old target point T.
This is like shooting artillery. You overshot the enemy? Aim shorter the next time. It's also what happens when you treat common causes as if theys were special causes.
The resulting pattern is still circular, but around 30% larger in area:
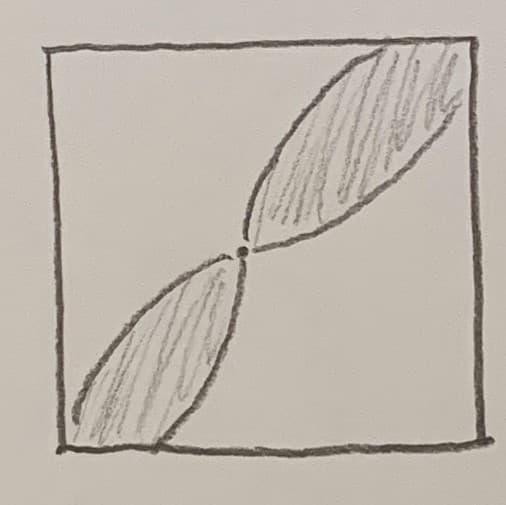
The third strategy is similar to the second, except you don't compare the hit point H to the last target point T, but always to the original target point in the middle of the paper.
The resulting pattern looks a bit like a propeller, the target point oscillates between two sectors, and the whole experiment diverges, that is, the error gets larger and larger:
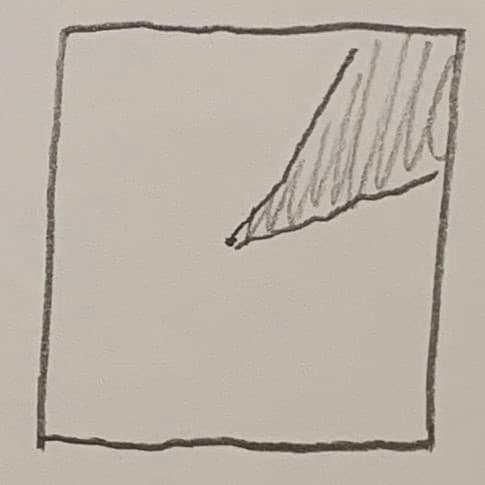
The fourth strategy looks equally wild. You just target the last hit point, so T' = H. Why would you do that? You wouldn't, of course, in this experiment. But it is pretty much the game of telephone. You aim for what the last person told you. Or, in other words, this is teaching someone, without a common and stable textbook. When one machine operator teaches his successor, the successor gets most of it, but not quite all. When this operator now teaches his successor, and the original operator is no longer around, your training diverges, just as those balls do here.
And the resulting pattern looks just like it: it diverges fast, and generally in one direction, there isn't much zig-zagging around:
So it is crucial to treat common errors with process improvement, and special errors with, well, special action. But how do you distinguish between those two kinds? It wouldn't help to know it only in hindsight, from the success or failure of the treatment.
Distinguishing between the types of errors
Common causes and special causes can be distinguished mathematically. The basis for that distinction is the Control chart (also called Shewhart chart or process-behaviour chart).
The y axis depicts a continuous measurement, the target line corresponds to the ideal. There is an upper control limit UCL and a lower control limit LCL. Both sit at +3σ and -3σ, respectively.
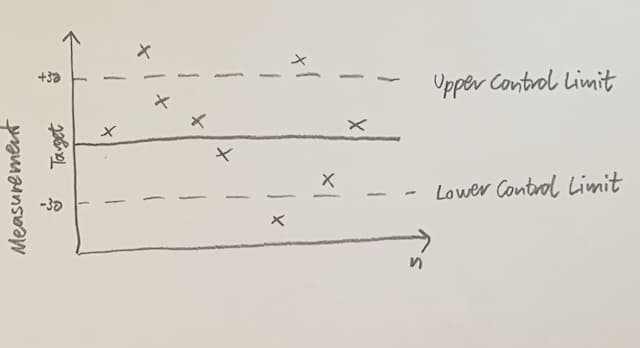
UCL and LCL are calculated from real data! Those are no specification limits.
Quote
Using the manufacturer's claim as the lower control limit (action limit) is confusing special causes with common causes, making matters worse, guaranteeing trouble forever.
A wiser procedure would be to get statistical control of the machine, under the circumstances in place. Its performance might turn out to be 90 per cent of the maximum speed as specified by the manufacturer, or 100 per cent, or 110 per cent. The next step would be the continual improvement of the machine and use thereof.
By the way
As far as I understand it, there isn't a hard theorem why they should sit at +/-3σ, but there is both empirical evidence for it and statistical arguments that suggest values in that ballpark.
You plot your measurements on the control chart. This is not an inspection in the sense that Deming despises. You do not check the widgets against defines tolerances and decide whether to keep them. You plot the behaviour of your process. Now it's real simple: everything within that +/-3σ band is a common cause, everything outside of that band is a special cause.
Only that would be too simple and not depicting reality accurately enough. So several rule sets were developed, two of the best-known are the Western Electric Rules and the Nelson Rules. Both are a bit more involved than just “inside or outside?”, they look at certain runs of measurements. For example, when the measurement continually alternates between the positive and the negative side of the y axis, it doesn't look like a common cause, but like a special cause inducing oscillation.
A process is said to be “in control” when only common cause errors are left. It may not be good process, it may not be centered or it may have a wide variance, but it is under control. That's a big plus, and you can work on improving your process.
But when the control chart signifies that most of your problems are special causes, you're in trouble: your process is strained and decidedly not in control. It may be an old, worn-out machine, it may be insufficiently trained or overstressed workers, but you need to get it back in control by treating the special cause errors first.
Summary
- Systems are important
- From absolute specification limits and tolerances towards statistical process control
- Common causes: improve the process, nothing else
- Special causes: Individual corrections
- Distinguish by control chart